
Coding
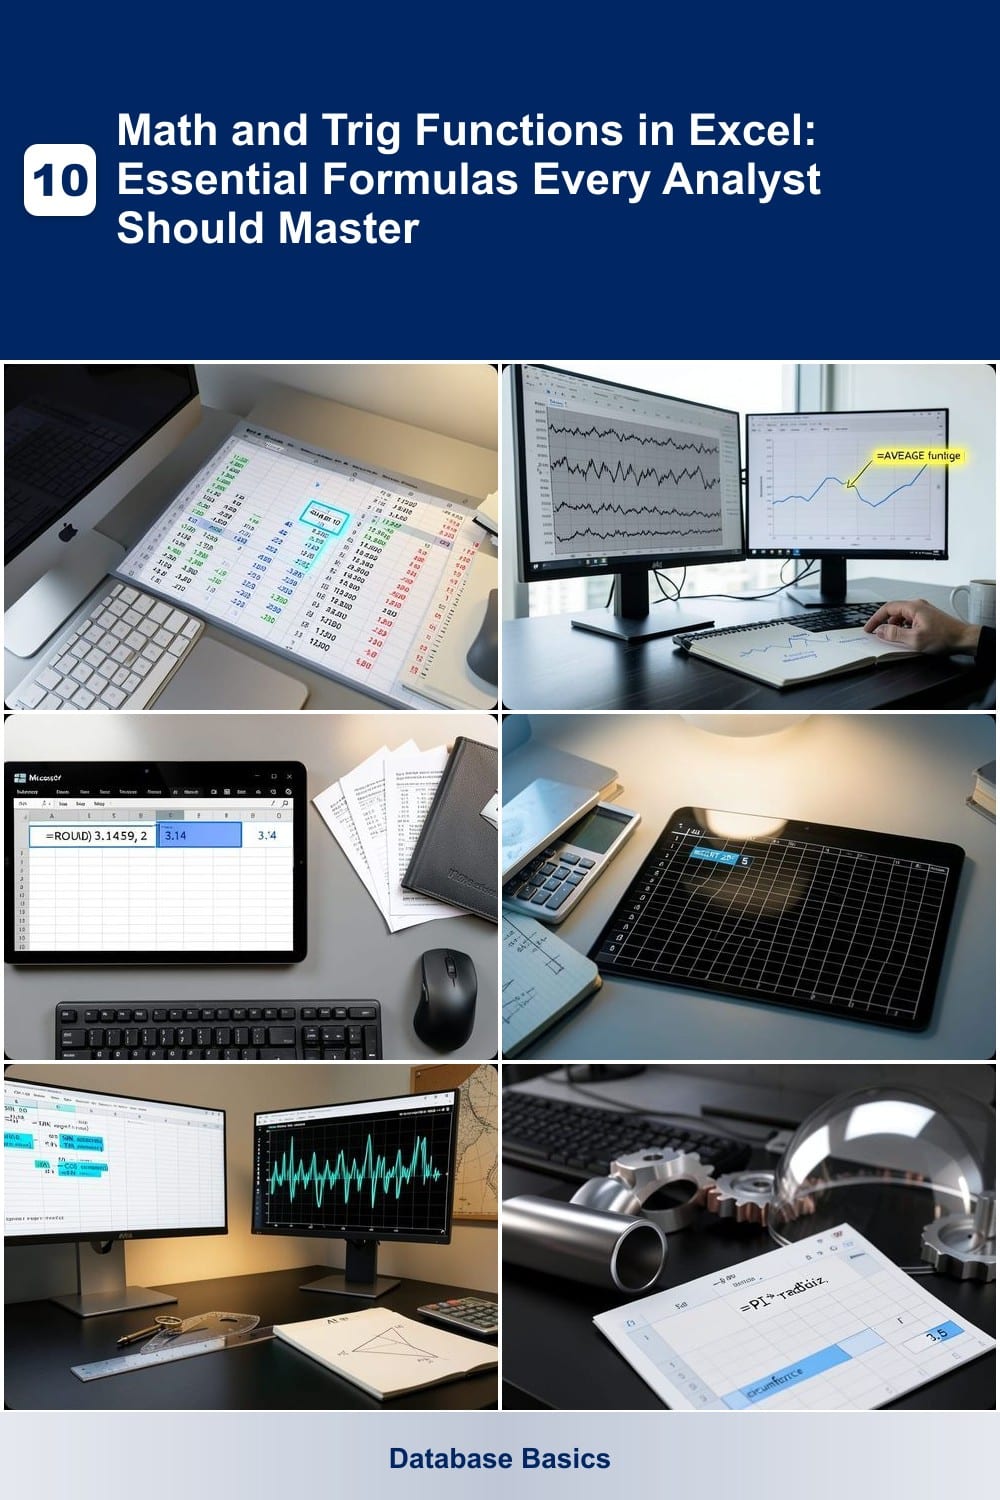
Mastering Excel’s math and trig functions can transform your data analysis workflow. These 10 essential formulas—from basic arithmetic to advanced trigonometry—help analysts solve complex problems, automate calculations, and unlock deeper insights in spreadsheets.
SUM Function for Basic Arithmetic Calculations

Need to tally up numbers faster than a calculator? The SUM function in Excel is your go-to tool for adding values in rows, columns, or entire ranges—no manual calculations required. Whether you're crunching sales figures, tracking inventory, or summarizing expenses, this function saves time and reduces errors with just a few clicks.
Type =SUM(range) in any cell, and Excel instantly calculates the total for the selected cells. For example, =SUM(A1:A10) adds values from A1 through A10. You can even combine multiple ranges: =SUM(A1:A5, B1:B5) sums two separate columns. The function also works with non-adjacent cells by listing them individually: =SUM(A1, C3, E5).
Perfect for accountants, project managers, or anyone handling numeric data, the SUM function is the first step toward mastering Excel’s math capabilities. ⚡
AVERAGE Function for Mean Value Analysis

When you need to turn raw numbers into actionable insights, the AVERAGE function is your go-to tool. Unlike simple sums, it calculates the mean value of a dataset—critical for identifying trends, spotting anomalies, or benchmarking performance across industries like manufacturing, finance, and healthcare.
Just type =AVERAGE(range) in any cell, and Excel instantly computes the arithmetic mean. For example, use it to track monthly sales averages, calculate student test scores, or monitor machine efficiency metrics. It even ignores text and logical values, focusing only on numeric data. Combine it with conditional formatting to highlight above/below-average values at a glance.
This function is a must for analysts, teachers, and small business owners who rely on data-driven decisions. Whether you're optimizing inventory levels or grading exams, AVERAGE turns numbers into clarity. ✨
ROUND Function for Precision Control
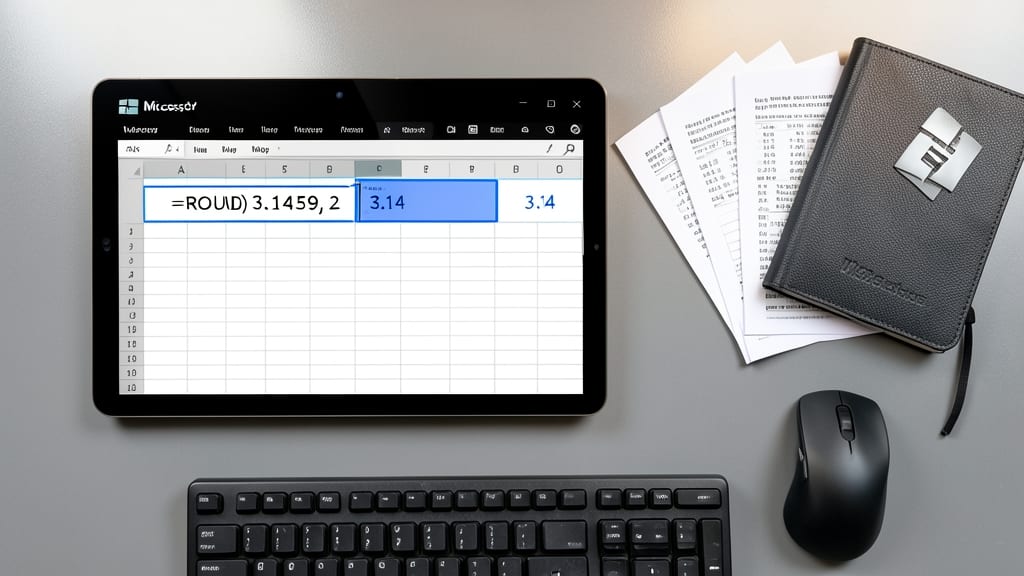
Tired of messy decimals ruining your polished reports? The ROUND function in Excel is your secret weapon for clean, professional-looking numbers—without sacrificing accuracy.
With just two arguments—number and decimals—you can instantly round values up or down. For example, =ROUND(3.14159, 2) transforms π into 3.14, perfect for financial reports where $123.456 becomes $123.46. Need to round down? Use ROUNDDOWN, or round up with ROUNDUP for conservative estimates.
Accountants, scientists, and presenters will love this function for its ability to maintain precision while keeping data visually clean. It’s the unsung hero of data clarity! ✨
SQRT Function for Square Root Calculations

Need to calculate distances, areas, or standard deviations without breaking out a calculator? The SQRT function in Excel handles square roots effortlessly—perfect for engineers, physicists, or anyone analyzing data with root-based metrics.
Simply type =SQRT(number) to return the square root of a positive value. For example, =SQRT(25) instantly returns 5, while =SQRT(A2) pulls the root from cell A2. It’s also the backbone of formulas like standard deviation (STDEV) or Pythagorean theorem calculations—just combine it with POWER or SUM for advanced geometry.
Engineers use it to compute signal strengths or stress analysis, while statisticians rely on it for root-mean-square (RMS) values. If you’re working with circular motion, wave equations, or error margins, this function saves hours of manual math. ✨
SIN, COS, and TAN for Trigonometric Analysis

Need to calculate wave frequencies, structural angles, or geographic coordinates? Excel’s SIN, COS, and TAN functions turn degrees into ratios—critical for engineers, physicists, and spatial analysts alike.
Use =SIN(angleinradians) to find opposite/hypotenuse ratios, =COS(angleinradians) for adjacent/hypotenuse, or =TAN(angleinradians) for opposite/adjacent. For example, =SIN(PI()/4) returns 0.7071 (the sine of 45°). Pair these with DEGREES() or RADIANS() to handle unit conversions seamlessly.
Perfect for modeling sound waves, designing bridges, or analyzing terrain slopes—these functions bridge theory and real-world data. ✨
PI Function for Circular Calculations

When your projects involve pipes, gears, or domes, the PI() function in Excel becomes your geometry shortcut. Forget memorizing formulas—just plug in a radius, and Excel handles the rest, whether you're calculating the circumference of a pipe or the surface area of a spherical tank.
The PI() function returns a precise value of 3.14159265358979 (15 decimal places), which you can multiply by a radius squared to find area or by diameter to get circumference. For 3D objects like spheres or cylinders, combine it with other functions like POWER() for volume calculations—no calculator needed.
Engineers, architects, and DIYers designing circular components will find this function a game-changer for rapid prototyping. It’s also perfect for converting between linear and circular measurements in manufacturing blueprints. ✨
POWER Function for Exponential Calculations

When your data involves growth rates, compound interest, or scientific notation, the POWER function becomes your secret weapon. Unlike basic arithmetic, this function calculates exponential values—like population growth, investment returns, or molecular decay—with just two inputs: the base and exponent.
Use =POWER(base, exponent) to model scenarios like $10,000 growing at 5% annually for 10 years (=POWER(1.05, 10)) or bacterial cultures doubling every 20 minutes. It even handles negative exponents for fractions (e.g., =POWER(100, -2) returns 0.01). The function’s precision shines in financial projections or biological modeling, where small errors compound dramatically.
Perfect for analysts, scientists, or anyone crunching numbers where linear thinking falls short. Master this, and you’ll turn complex exponential problems into simple, scalable formulas. ✨
DEGREES and RADIANS for Unit Conversion

When your data mixes degrees and radians—like GPS coordinates or physics simulations—DEGREES and RADIANS in Excel bridge the gap instantly. These functions ensure your trig calculations stay accurate whether your input is in 360° format or π radians, avoiding costly unit-mismatch errors.
The DEGREES function converts radians to degrees (e.g., =DEGREES(PI()/2) returns 90°), while RADIANS does the reverse (e.g., =RADIANS(180) gives π). Pair them with SIN/COS/TAN for seamless spatial data analysis, like mapping or structural engineering, where angles dictate precision.
Perfect for GIS professionals, robotics engineers, or anyone integrating data from different scientific disciplines. No more manual conversions—just plug in the formula and let Excel handle the math. ✨
ATAN2 Function for Advanced Angle Calculations

When standard trig functions like TAN leave you guessing about direction, ATAN2 steps in to deliver precise angles from x/y coordinates—no more quadrant confusion. This function is the secret weapon for developers, engineers, and data analysts working with directional data where accuracy matters.
Unlike ATAN, which fails to distinguish between positive and negative values, ATAN2(y,x) returns the correct angle in radians between -π and π, accounting for all four quadrants. Perfect for calculating compass bearings, robot pathfinding, or even game character movement, it handles edge cases like zero values with ease. Simply input your x and y coordinates, and it spits out the exact angle you need.
This is the go-to function for anyone modeling movement or spatial relationships—whether you're mapping GPS coordinates, programming AI navigation, or analyzing vector fields. ⚡
LOG and LOG10 for Logarithmic Scaling

When your data stretches from tiny fractions to astronomical numbers, LOG and LOG10 become your secret weapon. These functions don’t just crunch numbers—they rescale exponential growth into manageable linear trends, making patterns visible where chaos once reigned.
Use LOG for natural logarithm calculations (base e) or LOG10 for base-10 scaling—perfect for converting decibels in audio analysis, compressing financial datasets, or modeling population growth. For example, =LOG10(1000) returns 3, simplifying massive value comparisons. Pair them with POWER for inverse transformations, and you’ve got a dynamic duo for scientific modeling.
Researchers, audio engineers, and data scientists rely on these to visualize trends without distortion. For anyone wrestling with exponential data, they’re the difference between guesswork and precision. ✨